
Where Is Bounce Rate in GA4?
No time for long YouTube tutorials? Try Guidy and get it all done in minutes. It sits right on your screen and points you to exactly what to do in real time. And it works on any software or browser, in any language.
Try for free
Bounce rate exists in Google Analytics 4, but it does not appear in any standard report by default. Google removed it from the default view deliberately, because GA4 is built around engagement rate as the primary quality signal and bounce rate is now simply its mathematical opposite. To see it, you add it to a report yourself, which takes about a minute and requires Editor or Administrator access to the property. Here is the exact path, plus the reason your new number will look nothing like your old one.
Add bounce rate to a standard report
The steps below work on any detail report. Reports, then Engagement, then Pages and screens is the most useful starting point, and Reports, then Acquisition, then Traffic acquisition is the other common choice.
- Sign in to Google Analytics and select Reports from the left menu.
- Open the report you want, such as Pages and screens.
- Click Customize report, the pencil icon in the upper-right corner of the report.
- Under Report data, click Metrics.
- Click Add metric near the bottom of the panel and type Bounce rate.
- Select it, then click Apply.
- Click Save, then choose either Save changes to current report or Save as a new report.
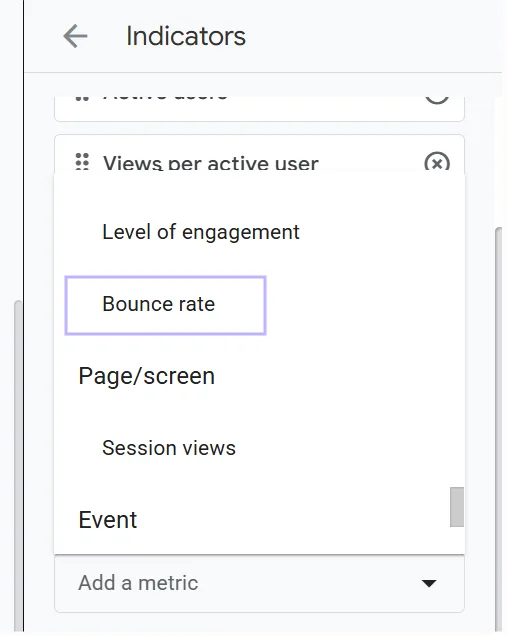
Figure 1: Here, I use Guidy to show you where bounce rate is, step by step, in real time.
Bounce rate is added as a column at the far right of the table, so you may need to scroll sideways to see it. You can drag it further left in the metrics list before applying if you would rather it sat next to sessions.
Two things that block this
You do not see the pencil icon. Customizing a report requires an Editor or Administrator role on the property. Viewers cannot do it. If the icon is absent, that is the reason, and someone with the right role has to either make the change or upgrade your access.
You see Add Cards instead of Metrics. You are in an overview report, which is the summary page with the card layout. Metrics can only be added to detail reports, which are the ones with a data table. Navigate into a detail report and try again.
There is also a useful quirk in the Add metric box: if you type Bounce rate and nothing appears in the list, the metric is already in that report. Scroll the table sideways rather than adding it twice.
The Explorations route
If you would rather not modify a standard report, or you do not have the permissions to, build the view in Explorations instead.
Open Explore, start a blank exploration, and drag your chosen dimension into Rows, such as Landing page or Session source. Then add Bounce rate from the metrics list into Values. This creates a private view that does not change anything for the rest of your organization, which is often the more diplomatic option on a shared property.
Why your GA4 bounce rate looks wrong
It is not wrong, it is a different metric with the same name, and this is the single biggest source of confusion for anyone who migrated from Universal Analytics.
In Universal Analytics, a bounce was a session with only one page view. Simple, and unfair to any page that answered the question on the first screen.
In GA4, bounce rate is the percentage of sessions that were not engaged. A session counts as engaged if it meets any one of three conditions: it lasted longer than ten seconds, it included a key event, or it included at least two page views. A bounce is therefore a session that was under ten seconds, had one page view, and triggered no key event.
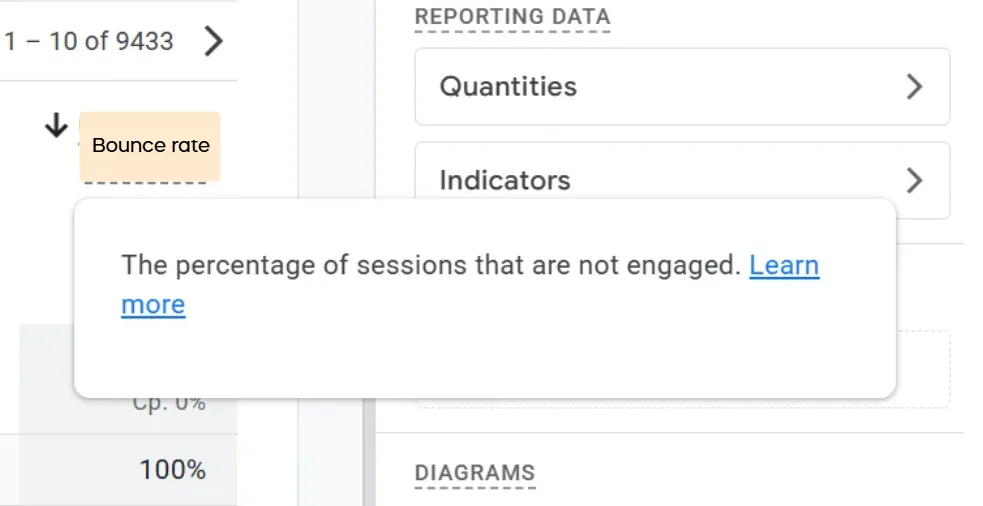
Figure 2: How bounce rate appears in a Report.
The practical consequence is that GA4 bounce rates are usually far lower than the Universal Analytics numbers people remember, because a visitor who reads a page for twenty seconds and leaves is now engaged rather than bounced. Comparing the two directly tells you nothing. Comparing GA4 to GA4 over time is the only sound approach.
Bounce rate is also always exactly 100 percent minus engagement rate. If you already report engagement rate, adding bounce rate gives you no new information, only a familiar-looking framing for people who prefer it.
Reading the number without misleading yourself
Context decides whether a high bounce rate is a problem. A reference page that answers a question in one screen can bounce at 85 percent and be doing its job perfectly. A pricing page or a category page bouncing at the same rate is broken.
The useful move is to segment rather than average. Break the number down by landing page, by device, and by traffic source. A bounce rate that is uniformly high across everything usually points at a tracking problem rather than a content one, and a spike confined to mobile usually points at a layout or speed issue on that breakpoint.
GA4 also changes its interface regularly, which is why guides like this one go stale so quickly. If you find yourself hunting through menus more often than you would like, Guidy reads your screen and points at the setting you actually need in the version of GA4 you are looking at, rather than the one that existed when a tutorial was written. It works the same way across the other tools people lose time in, which is covered on our AI assistant for work page.
Key takeaways
- Bounce rate exists in GA4 but appears in no standard report by default. Google built the product around engagement rate, and bounce rate is now its mathematical opposite.
- The path: open a detail report, click Customize report (the pencil icon, upper right), then Metrics, then Add metric, type Bounce rate, Apply, then Save.
- You need Editor or Administrator access on the property. If the pencil icon is not there, that is why.
- Metrics can only be added to detail reports. If you are being offered Add Cards instead of Metrics, you are in an overview report and need to navigate into a table view.
- GA4 bounce rate is not the Universal Analytics metric wearing the same name. A session counts as engaged if it lasted over ten seconds, included a key event, or included at least two page views, so GA4 numbers run far lower. Bounce rate is always exactly 100 percent minus engagement rate.
FAQs
Where is bounce rate in GA4?
It is not in any standard report by default. Open a detail report such as Reports, then Engagement, then Pages and screens, click the pencil icon labeled Customize report in the upper right, then Metrics, then Add metric, type Bounce rate, and click Apply and Save.
Why is GA4 not letting me add bounce rate?
Two common reasons. Customizing reports requires an Editor or Administrator role, so the pencil icon will not appear for Viewers. And metrics can only be added to detail reports, so if you see Add Cards rather than Metrics, you are in an overview report and need to open a detail report instead.
How is bounce rate calculated in GA4?
It is the percentage of sessions that were not engaged, which makes it exactly 100 percent minus engagement rate. A session counts as engaged if it lasted over ten seconds, included a key event, or included two or more page views.
Why is my GA4 bounce rate so different from Universal Analytics?
Because the definitions differ. Universal Analytics counted any single-page session as a bounce, while GA4 counts a session as engaged if it passes any one of three thresholds. GA4 numbers are typically much lower, and the two are not comparable.
What is a good bounce rate in GA4?
It depends entirely on the page's job. A reference page that answers a question immediately can bounce high and still succeed, while a pricing or category page with the same rate almost certainly has a problem. Segment by landing page, device, and source rather than chasing a single site-wide number.
What does bounce rate mean in GA4?
In GA4, bounce rate is the percentage of your sessions that weren't engaged, the exact inverse of engagement rate. A session counts as engaged if it lasted longer than ten seconds, fired a key event, or had two or more page views, so a bounce is a visit that did none of those. It isn't the old Universal Analytics bounce, which counted any single-page session, so the GA4 figure usually reads much lower.
Is a 20% bounce rate good in GA4?
On its own, no bounce rate is good or bad; it depends on what the page is for. A 20% rate means most visitors engaged, which is a healthy sign for a page meant to pull people deeper, like a pricing or category page. But a reference page that answers the question in one screen can bounce far higher and still be doing its job perfectly. Segment by landing page, device, and traffic source rather than judging a single site-wide number.